The KPIs of Payment Fraud Prevention
In this whitepaper, I am taking you in on the fine art of measuring the business outcome of payment fraud prevention systems. In this first chapter, I am discussing the primary performance criteria, and explain why the industry has defined them the way they are, and how you can use this to calibrate your fraud prevention operations.
The payment industry uses two KPIs to describe the performance of a fraud prevention system: hit rate and false positives rate.
Hit rate
The hit rate is calculated as the total monetary value of all correctly identified fraud divided by the total amount of fraud attempted. It is typically expressed as a percentage value. If you had $1M of total annual fraud without any fraud prevention system, and when you turn on your fraud prevention system, you reduce it to $400K fraud losses, the hit rate would be 60%. A hit rate of 100% would represent a perfect fraud prevention system and a hit rate of 0% would represent a completely non functional one.
False positive rate
The false positive rate is calculated as the number of falsely rejected payment requests divided by the number of correctly rejected payment requests. Notice that falsely rejected payment requests are transactions that would have been legitimate if they were accepted. They represent the situation that a legitimate customer attempted a legitimate payment, and was falsely rejected. This causes disruption for the customer, and if you wanted to define "customer dissatisfaction" with a payment system, a legitimate payment rejected by the bank or FI is about as dissatisfying to a customer as it gets.
A typical value for false positive rates for card fraud prevention would be 1:8. This means that you would have 8 rejected legitimate payments for each correctly rejected fraudulent payment. That sounds like a high number, but you have to consider that only about one out of 2,000 card payment requests are fraudulent. Still, causing 8 legitimate payment transactions to be falsely rejected is a "considerable price" for correctly rejecting one fraudulent payment.
No prediction is perfect
And this is the first lesson: there is always a "price" for preventing payment fraud. There is no prevention system without false positives. It is about predicting now whether or not a payment request will turn out to be fraud later on. Just like a weather forecast is sometimes wrong, a fraud prevention system is also sometimes wrong. In other words, the "price" of preventing payment fraud are the false positives.
The way our industry deals with this is to find the most appropriate "compromise" between a high enough hit rate, and a low enough false positive rate. All fraud prevention systems can thus be adjusted by setting the "risk score" threshold for rejection. A low threshold implies that payment requests with even medium risk scores are rejected, resulting in high hit rates, but also many false positives. A high threshold implies the opposite, low hit rates, but also low false positives.
Setting performance
This is an example representing a typical card issuing fraud prevention performance:
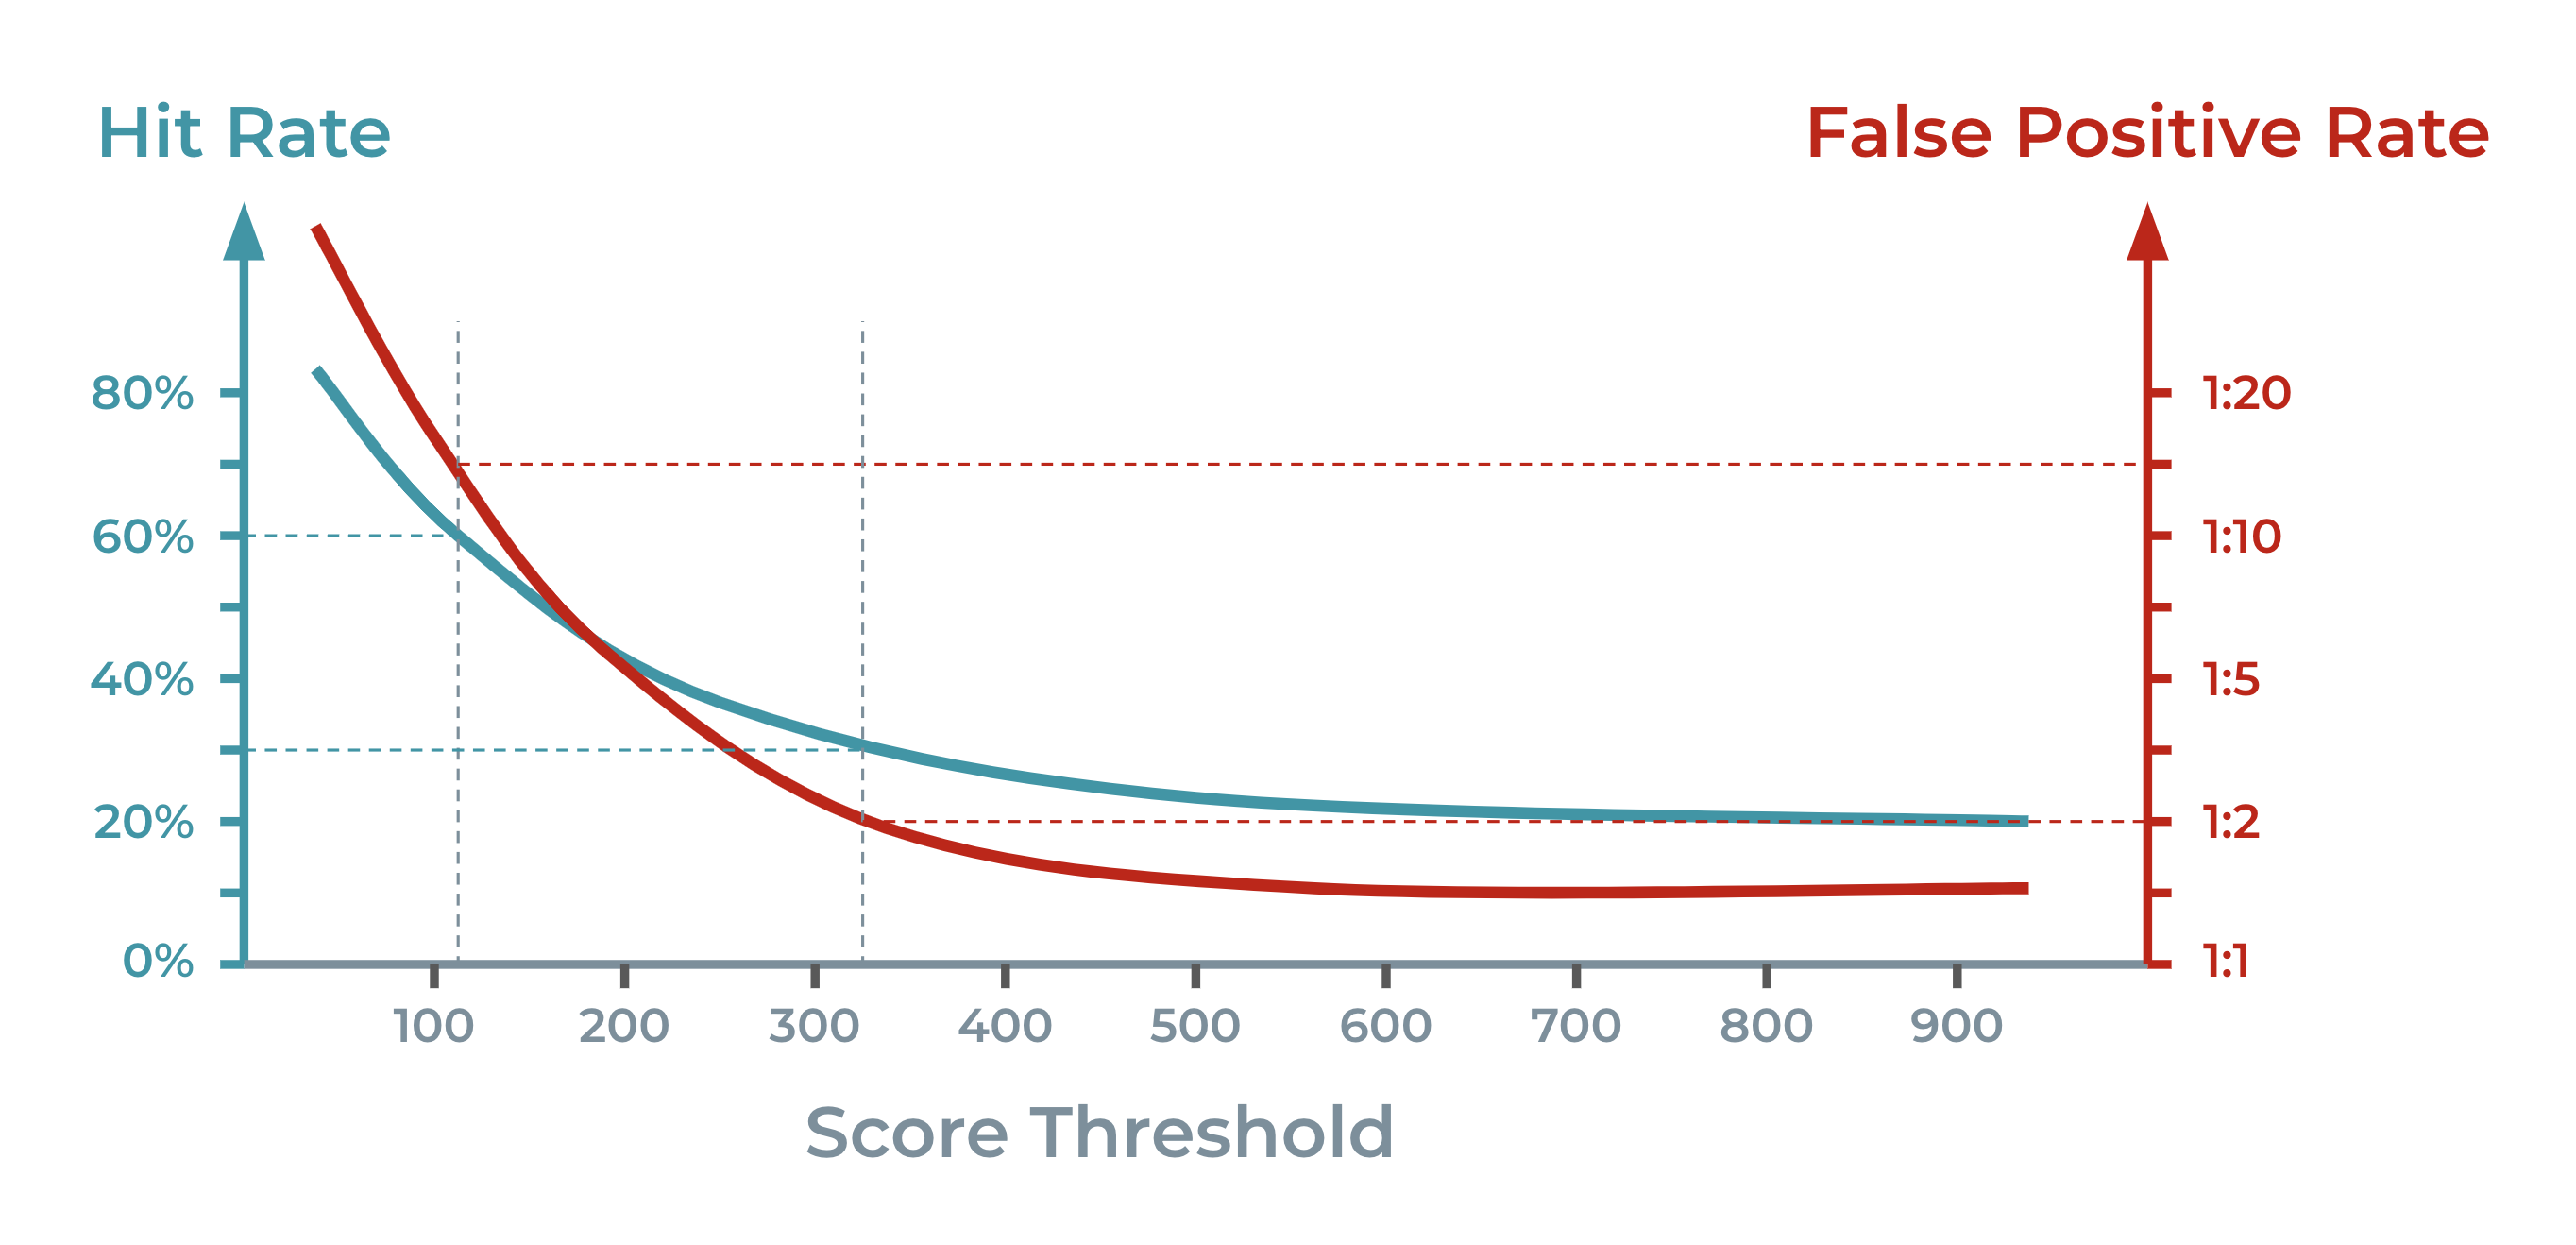
The chart shows that if you wanted to achieve a 60% fraud hit rate, you would have to reject any payment request with a score above 115, and that you would experience a false positive rate of 1:15. If you wanted to achieve a 30% fraud hit rate, you would have to reject any payment request with a score above 325, and that you would experience a false positive rate of 1:2.
Summary
You cannot prevent fraud losses by declining high fraud risk transactions in real-time without incurring false alerts. False alerts are a terrible customer experience since you are preventing a customer from making a legitimate payment. However, by adjusting the risk threshold for rejecting payment requests, you can balance between fraud loss reduction (aka “hit rate”) and false positives. The “detection performance” of your fraud prevention operation is how much you can achieve both a high hit rate and low false positives.
If you like to dive more into the subjects, please continue to read.
Deep dives
There are a number of aspects I covered only superficially above for which a deeper dive is interesting. Please read below.
Statistics
If you have a background in statistics, you might be surprised to learn that payment fraud prevention is using hit rate and false positive rate as their primary KPIs. In statistics, the standard plot to show the performance of a binary classifier is the ROC curve (receiver operating characteristic curve).
The main reason why typically ROC curves are not used is that payments are not equal. They differ very much by their amount, which, in case a payment turns out to be fraud, becomes a loss. Simply said, 100 payments of $1 that turn out to be fraud and one payment of $100 that turns out to be fraud both cause the same financial loss.
This is why the hit rate is defined as “total fraud losses prevented divided by total fraud losses”, and not “total number of fraudulent payments prevented divided by total fraudulent payments”.
Notice that on the other hand, the false positive rate typically is by number of transactions. This is because the primary negative effect of a false alert is a customer that is disrupted making a legitimate payment. This negative impact on the customer satisfaction is typically not strongly dependent on the amount of the transaction.
Scores
Above I assumed that fraud prevention systems provide a risk score in the interval from 0 to 999. This definition stems from earlier consumer creditworthiness ratings and is thus established in the financial industry. It is, however, arbitrary. Risk scores can have any interval and they can either be related to a probability or not.
Notice that if you produce a score as the predicted probability of the current payment request turning out to be fraudulent later on, it becomes more “useful” to make an authorise/reject decision from it. You can also multiply the probability of an individual payment request with the predicted probability for it to be fraudulent with the amount of the payment request. This gets you a “predicted loss” amount that you can compare to the revenue you would be making for processing this transaction to understand which payment requests are profitable to process, and which are not.
Rule based fraud prevention
Any fraud prevention system is using decision rules. If only as “policy rules” to determine how the score of AI models shall be applied to what type of payment request. There are also fraud prevention systems that entirely rely on “fraud rules” to identify criminal behaviour entirely from expert analysis. Most fraud prevention systems use a combination of AI models, fraud rules, and policy rules. Some even utilise machine learning to create and adapt rules.
If fraud rules are used, they typically are well-defined for a specific behavioural pattern, and if the rules apply, they directly trigger a rejection of a payment request. Therefore, you do not automatically get a score as the output of a fraud rule set as you do from most AI scoring models. You still can perform the “hit rate vs. false positive rate” analyses I described above by sorting rules according to their predictive quality and then enabling them in descending order.
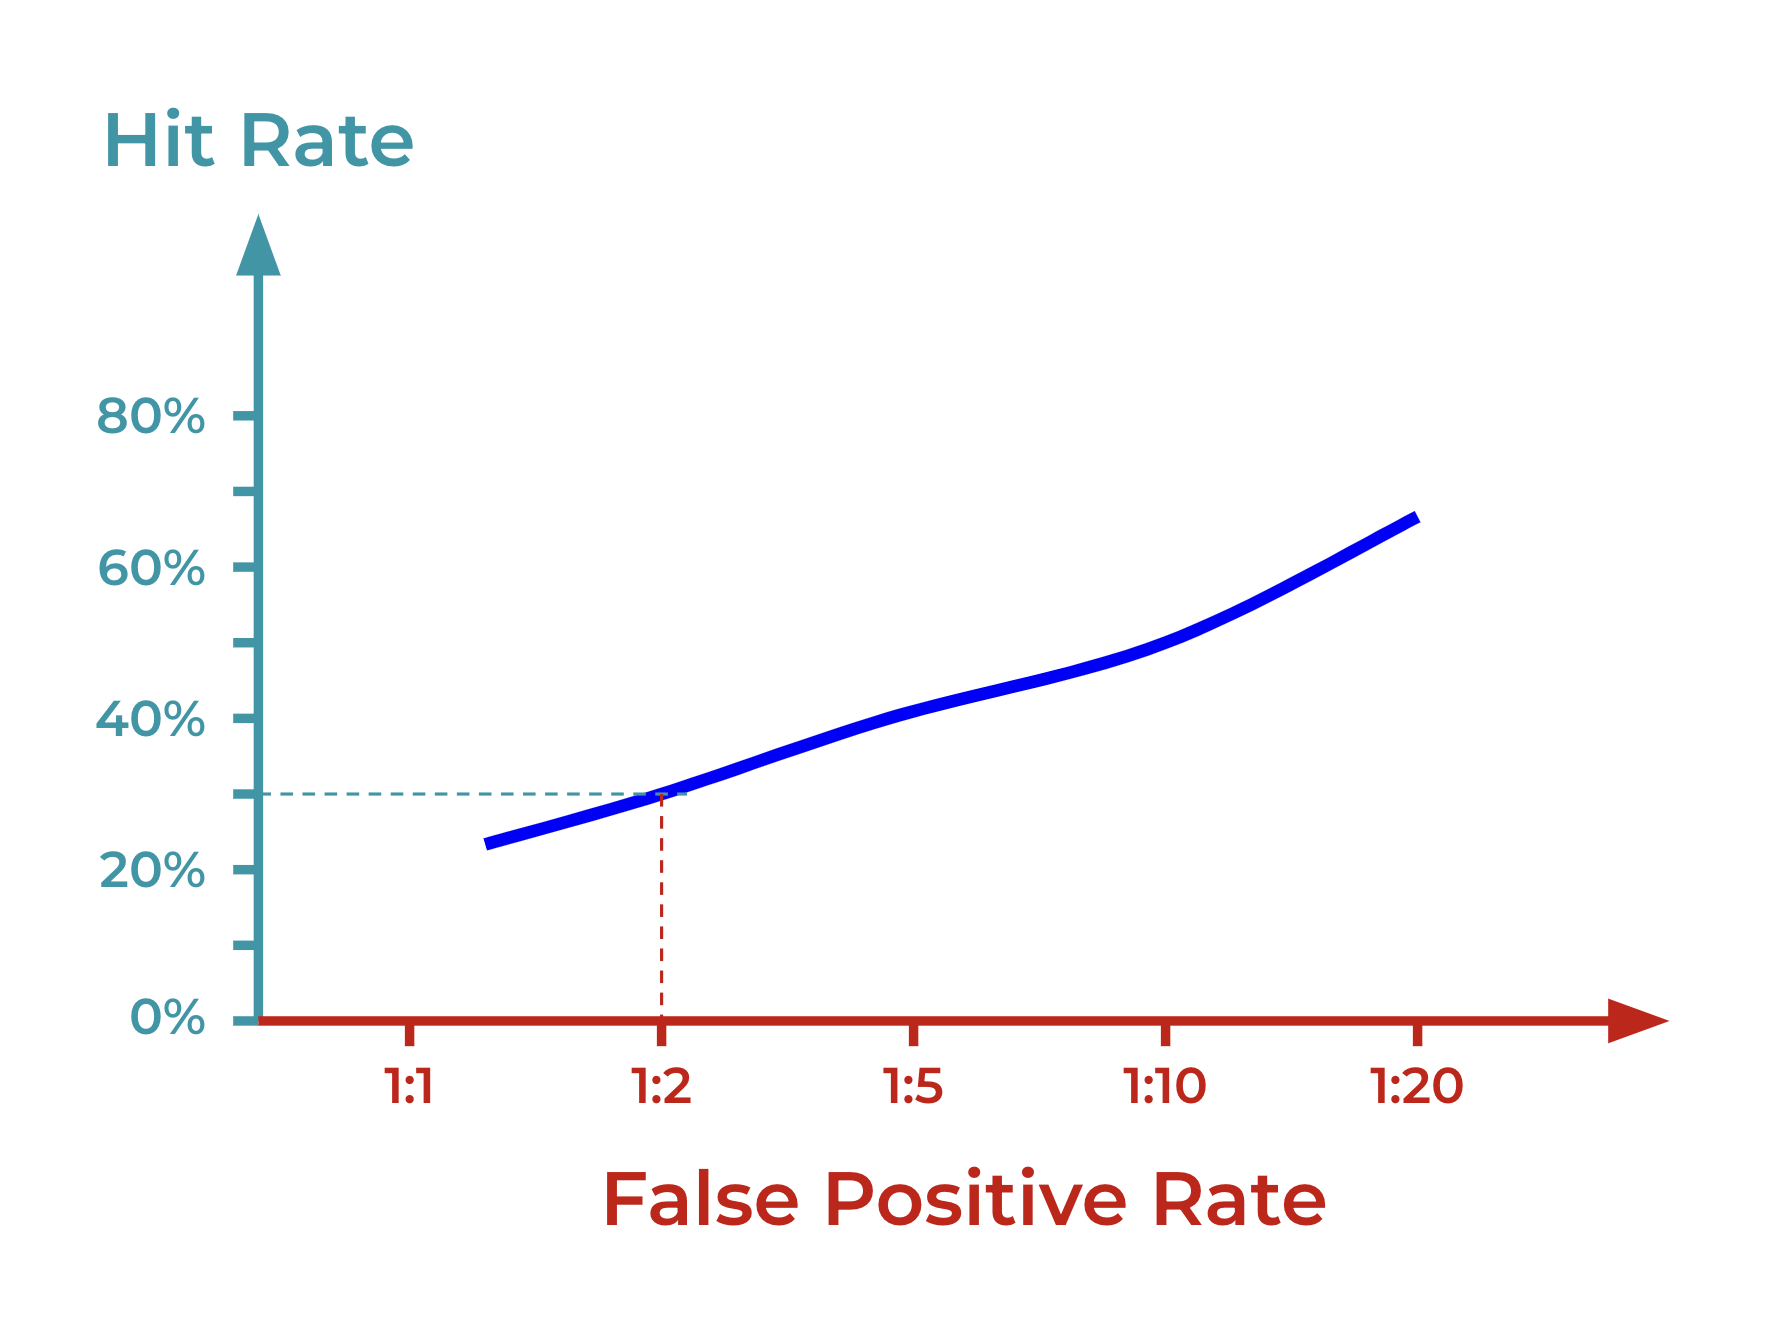
Hit rate vs false positive rate
You can also directly draw hit rate vs. false positive rate to find the best compromise: